Resource Allocation Graph-
Before you go through this article, make sure that you have gone through the previous article on Resource Allocation Graph.
We have discussed-
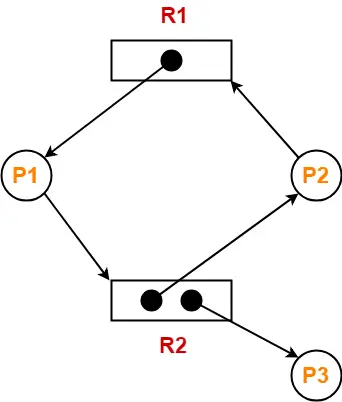
- Resource Allocation Graph (RAG) is a graph that represents the state of a system pictorially.
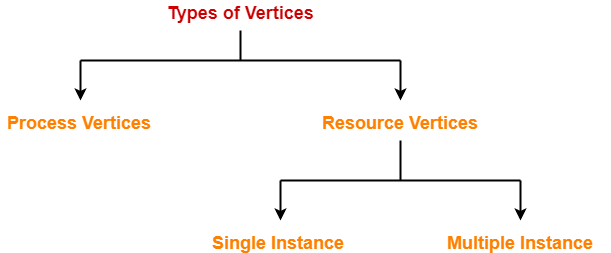
- There are two components of RAG- Vertices and Edges.
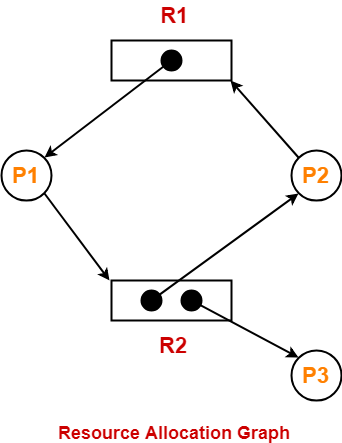
Deadlock Detection-
Using Resource Allocation Graph, it can be easily detected whether system is in a Deadlock state or not.
The rules are-
Rule-01:
In a Resource Allocation Graph where all the resources are single instance,
- If a cycle is being formed, then system is in a deadlock state.
- If no cycle is being formed, then system is not in a deadlock state.
Rule-02:
In a Resource Allocation Graph where all the resources are NOT single instance,
- If a cycle is being formed, then system may be in a deadlock state.
- Banker’s Algorithm is applied to confirm whether system is in a deadlock state or not.
- If no cycle is being formed, then system is not in a deadlock state.
- Presence of a cycle is a necessary but not a sufficient condition for the occurrence of deadlock.
Also Read- Deadlock Handling Strategies
PRACTICE PROBLEMS BASED ON DETECTING DEADLOCK USING RAG-
Problem-01:
Consider the resource allocation graph in the figure-
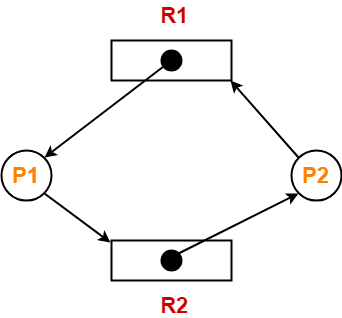
Find if the system is in a deadlock state otherwise find a safe sequence.
Solution-
Method-01:
- The given resource allocation graph is single instance with a cycle contained in it.
- Thus, the system is definitely in a deadlock state.
Method-02:
Using the given resource allocation graph, we have-
| Allocation | Need | |||
| R1 | R2 | R1 | R2 | |
| Process P1 | 1 | 0 | 0 | 1 |
| Process P2 | 0 | 1 | 1 | 0 |
Available = [ R1 R2 ] = [ 0 0 ]
Now,
- There are no instances available currently and both the processes require a resource to execute.
- Therefore, none of the process can be executed and both keeps waiting infinitely.
- Thus, the system is in a deadlock state.
Problem-02:
Consider the resource allocation graph in the figure-
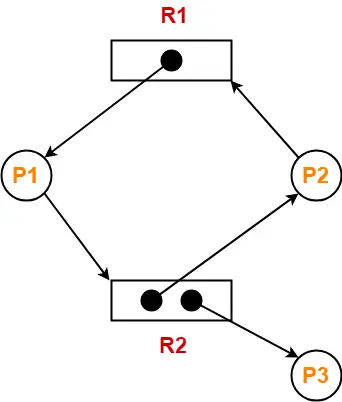
Find if the system is in a deadlock state otherwise find a safe sequence.
Solution-
- The given resource allocation graph is multi instance with a cycle contained in it.
- So, the system may or may not be in a deadlock state.
Using the given resource allocation graph, we have-
| Allocation | Need | |||
| R1 | R2 | R1 | R2 | |
| Process P1 | 1 | 0 | 0 | 1 |
| Process P2 | 0 | 1 | 1 | 0 |
| Process P3 | 0 | 1 | 0 | 0 |
Available = [ R1 R2 ] = [ 0 0 ]
Step-01:
- Since process P3 does not need any resource, so it executes.
- After execution, process P3 release its resources.
Then,
Available
= [ 0 0 ] + [ 0 1 ]
= [ 0 1 ]
Step-02:
- With the instances available currently, only the requirement of the process P1 can be satisfied.
- So, process P1 is allocated the requested resources.
- It completes its execution and then free up the instances of resources held by it.
Then-
Available
= [ 0 1 ] + [ 1 0 ]
= [ 1 1 ]
Step-03:
- With the instances available currently, the requirement of the process P2 can be satisfied.
- So, process P2 is allocated the requested resources.
- It completes its execution and then free up the instances of resources held by it.
Then-
Available
= [ 1 1 ] + [ 0 1 ]
= [ 1 2 ]
Thus,
- There exists a safe sequence P3, P1, P2 in which all the processes can be executed.
- So, the system is in a safe state.
Problem-03:
Consider the resource allocation graph in the figure-
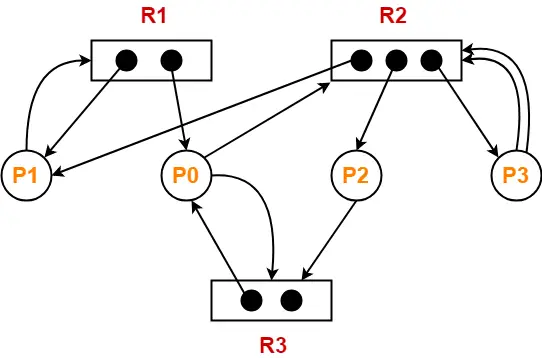
Find if the system is in a deadlock state otherwise find a safe sequence.
Solution-
- The given resource allocation graph is multi instance with a cycle contained in it.
- So, the system may or may not be in a deadlock state.
Using the given resource allocation graph, we have-
| Allocation | Need | |||||
| R1 | R2 | R3 | R1 | R2 | R3 | |
| Process P0 | 1 | 0 | 1 | 0 | 1 | 1 |
| Process P1 | 1 | 1 | 0 | 1 | 0 | 0 |
| Process P2 | 0 | 1 | 0 | 0 | 0 | 1 |
| Process P3 | 0 | 1 | 0 | 0 | 2 | 0 |
Available = [ R1 R2 R3 ] = [ 0 0 1 ]
Step-01:
- With the instances available currently, only the requirement of the process P2 can be satisfied.
- So, process P2 is allocated the requested resources.
- It completes its execution and then free up the instances of resources held by it.
Then-
Available
= [ 0 0 1 ] + [ 0 1 0 ]
= [ 0 1 1 ]
Step-02:
- With the instances available currently, only the requirement of the process P0 can be satisfied.
- So, process P0 is allocated the requested resources.
- It completes its execution and then free up the instances of resources held by it.
Then-
Available
= [ 0 1 1 ] + [ 1 0 1 ]
= [ 1 1 2 ]
Step-03:
- With the instances available currently, only the requirement of the process P1 can be satisfied.
- So, process P1 is allocated the requested resources.
- It completes its execution and then free up the instances of resources held by it.
Then-
Available
= [ 1 1 2 ] + [ 1 1 0 ]
= [ 2 2 2 ]
Step-04:
- With the instances available currently, the requirement of the process P3 can be satisfied.
- So, process P3 is allocated the requested resources.
- It completes its execution and then free up the instances of resources held by it.
Then-
Available
= [ 2 2 2 ] + [ 0 1 0 ]
= [ 2 3 2 ]
Thus,
- There exists a safe sequence P2, P0, P1, P3 in which all the processes can be executed.
- So, the system is in a safe state.
To watch video solutions and practice other problems,
Next Article- Contiguous Memory Allocation
Get more notes and other study material of Operating System.
Watch video lectures by visiting our YouTube channel LearnVidFun.
