Tag: Software Engineering Notes For UGC Net

Cause Effect Graph Technique | Examples

Cause Effect Graph-


  • Cause Effect Graph is a popular black box testing technique.
  • It illustrates the relationship between a given outcome and all the factors that influence the outcome graphically.


Here,

  • A “Cause” stands for a distinct input condition that fetches about an internal change in the system.
  • An “Effect” represents an output condition, a system state that results from a combination of causes.


Applications-


  • For analyzing the existing problem so that corrective actions can be taken at the earliest.
  • For relating the interactions of the system with the factors affecting a particular process.
  • For identifying the possible root causes, reasons for a particular effect, problem or outcome.


Advantages-


  • It helps to determine the root causes of a problem or quality.
  • It indicates possible causes of variation in a process.
  • It identifies those areas where data should be collected for further study.
  • It utilizes the team knowledge of the process by encouraging team participation.


Steps For Drawing Cause Effect Diagram-


The following steps are followed-

  • Identify and describe the input conditions (causes) and actions (effect).
  • Build up a cause-effect graph.
  • Convert cause-effect graph into a decision table.
  • Convert decision table rules to test cases where each column of the decision table represents a test case.


PRACTICE PROBLEMS BASED ON CAUSE-EFFECT GRAPH TECHNIQUE-


Problem-01:


Design test cases for the following problem-

If the character of the first column is ‘A’ or ‘B’ and the second column is a number, then the file is considered updated. If the first character is erroneous, then message x should be printed. If the second column is not a number, then message y should be printed.


Solution-


Step-01:


Identify and describe the input conditions (causes) and actions (effect).


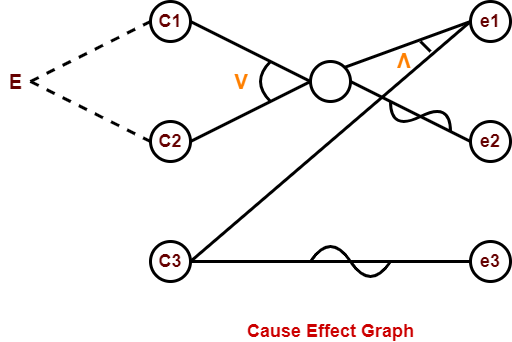
The causes represented by letter “C” are as follows-

  • C1 : The character in column 1 is ‘A’
  • C2 : The character in column 1 is ‘B’
  • C3 : The character in column 2 is a number


The effects represented by letter “e” are as follows-

  • e1 : File update is made
  • e2 : Message x is printed
  • e3 : Message y is printed


Step-02:


Build up a cause-effect graph-


Step-03:


Convert cause-effect graph into a decision table-


Test data Causes Effect
A1 A2 A3 M1 M2 M3
1 0 0 0 0 1 1
2 0 0 1 0 1 0
3 0 1 0 0 0 1
4 0 1 1 1 0 0
5 1 0 0 0 0 1
6 1 0 1 1 0 0


Problem-02:


Why Cause Effect Graphing Technique is Better Than Any Other Black Box Testing Technique?


Solution-


  • Boundary value analysis and equivalence partitioning do not explore combinations of input circumstances.
  • These only consider the single input conditions.
  • However, combinations of inputs may result in interesting situations.
  • These situations should be tested.
  • By considering all the valid combinations of equivalence classes, there will be large number of test cases.
  • Many of these test cases will not be useful for revealing any new errors.


On the other hand,

  • Cause Effect Graph is a technique that helps in selecting a high-yield set of test cases in a systematic way.
  • It has a beneficial effect in pointing out incompleteness and ambiguities in the specifications.


To gain better understanding about Cause Effect Graph Technique,

Watch this Video Lecture


Get more notes and other study material of Software Engineering.

Watch video lectures by visiting our YouTube channel LearnVidFun.
Cyclomatic Complexity | Calculation | Examples

Cyclomatic Complexity-


Cyclomatic Complexity may be defined as-

  • It is a software metric that measures the logical complexity of the program code.
  • It counts the number of decisions in the given program code.
  • It measures the number of linearly independent paths through the program code.


Cyclomatic complexity indicates several information about the program code-


Cyclomatic Complexity Meaning
1 – 10
  • Structured and Well Written Code
  • High Testability
  • Less Cost and Effort
10 – 20
  • Complex Code
  • Medium Testability
  • Medium Cost and Effort
20 – 40
  • Very Complex Code
  • Low Testability
  • High Cost and Effort
> 40
  • Highly Complex Code
  • Not at all Testable
  • Very High Cost and Effort


Importance of Cyclomatic Complexity-


  • It helps in determining the software quality.
  • It is an important indicator of program code’s readability, maintainability and portability.
  • It helps the developers and testers to determine independent path executions.
  • It helps to focus more on the uncovered paths.
  • It evaluates the risk associated with the application or program.
  • It provides assurance to the developers that all the paths have been tested at least once.


Properties of Cyclomatic Complexity-


  • It is the maximum number of independent paths through the program code.
  • It depends only on the number of decisions in the program code.
  • Insertion or deletion of functional statements from the code does not affect its cyclomatic complexity.
  • It is always greater than or equal to 1.


Calculating Cyclomatic Complexity-


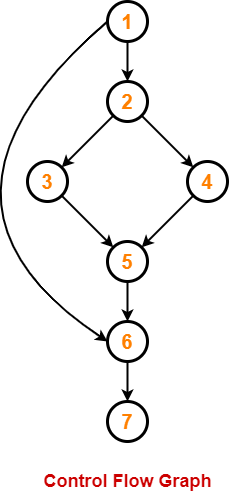
Cyclomatic complexity is calculated using the control flow representation of the program code.


In control flow representation of the program code,

  • Nodes represent parts of the code having no branches.
  • Edges represent possible control flow transfers during program execution


There are 3 commonly used methods for calculating the cyclomatic complexity-


Method-01:


Cyclomatic Complexity = Total number of closed regions in the control flow graph + 1


Method-02:


Cyclomatic Complexity = E – N + 2


Here-

  • E = Total number of edges in the control flow graph
  • N = Total number of nodes in the control flow graph


Method-03:


Cyclomatic Complexity = P + 1


Here,

P = Total number of predicate nodes contained in the control flow graph


Note-


  • Predicate nodes are the conditional nodes.
  • They give rise to two branches in the control flow graph.


PRACTICE PROBLEMS BASED ON CYCLOMATIC COMPLEXITY-


Problem-01:


Calculate cyclomatic complexity for the given code-

IF A = 354
   THEN IF B > C
        THEN A = B
        ELSE A = C
   END IF
END IF
PRINT A


Solution-


We draw the following control flow graph for the given code-


Using the above control flow graph, the cyclomatic complexity may be calculated as-


Method-01:


Cyclomatic Complexity

= Total number of closed regions in the control flow graph + 1

= 2 + 1

= 3


Method-02:


Cyclomatic Complexity

= E – N + 2

= 8 – 7 + 2

= 3


Method-03:


Cyclomatic Complexity

= P + 1

= 2 + 1

= 3


Problem-02:


Calculate cyclomatic complexity for the given code-

{ int i, j, k;
  for (i=0 ; i<=N ; i++)
  p[i] = 1;
  for (i=2 ; i<=N ; i++)
  {
     k = p[i]; j=1;
     while (a[p[j-1]] > a[k] {
         p[j] = p[j-1];
         j--;
  }
     p[j]=k;
}


Solution-


We draw the following control flow graph for the given code-


Using the above control flow graph, the cyclomatic complexity may be calculated as-


Method-01:


Cyclomatic Complexity

= Total number of closed regions in the control flow graph + 1

= 3 + 1

= 4


Method-02:


Cyclomatic Complexity

= E – N + 2

= 16 – 14 + 2

= 4


Method-03:


Cyclomatic Complexity

= P + 1

= 3 + 1

= 4


Problem-03:


Calculate cyclomatic complexity for the given code-

begin int x, y, power;
      float z;
      input(x, y);
      if(y<0)
      power = -y;
      else power = y;
      z=1;
      while(power!=0)
      {    z=z*x;
           power=power-1;
      } if(y<0)
      z=1/z;
      output(z);
      end


Solution-


We draw the following control flow graph for the given code-


Using the above control flow graph, the cyclomatic complexity may be calculated as-


Method-01:


Cyclomatic Complexity

= Total number of closed regions in the control flow graph + 1

= 3 + 1

= 4


Method-02:


Cyclomatic Complexity

= E – N + 2

= 16 – 14 + 2

= 4


Method-03:


Cyclomatic Complexity

= P + 1

= 3 + 1

= 4


To gain better understanding about Cyclomatic Complexity,

Watch this Video Lecture


Next Article- Cause Effect Graph Technique


Get more notes and other study material of Software Engineering.

Watch video lectures by visiting our YouTube channel LearnVidFun.