Tag: CPU Scheduling

CPU Scheduling | Practice Problems | Numericals

CPU Scheduling Algorithms-


Various CPU scheduling algorithms are-


PRACTICE PROBLEMS BASED ON CPU SCHEDULING ALGORITHMS-


Problem-01:


Consider three process, all arriving at time zero, with total execution time of 10, 20 and 30 units respectively. Each process spends the first 20% of execution time doing I/O, the next 70% of time doing computation, and the last 10% of time doing I/O again. The operating system uses a shortest remaining compute time first scheduling algorithm and schedules a new process either when the running process gets blocked on I/O or when the running process finishes its compute burst. Assume that all I/O operations can be overlapped as much as possible. For what percentage of does the CPU remain idle?

  1. 0%
  2. 10.6%
  3. 30.0%
  4. 89.4%


Solution-


According to question, we have-


Total Burst Time I/O Burst CPU Burst I/O Burst
Process P1 10 2 7 1
Process P2 20 4 14 2
Process P3 30 6 21 3


The scheduling algorithm used is Shortest Remaining Time First.


Gantt Chart-


Percentage of time CPU remains idle

= (5 / 47) x 100

= 10.638%

Thus, Option (B) is correct.


Problem-02:


Consider the set of 4 processes whose arrival time and burst time are given below-


Process No. Arrival Time Burst Time
CPU Burst I/O Burst CPU Burst
P1 0 3 2 2
P2 0 2 4 1
P3 2 1 3 2
P4 5 2 2 1


If the CPU scheduling policy is Shortest Remaining Time First, calculate the average waiting time and average turn around time.


Solution-


Gantt Chart-
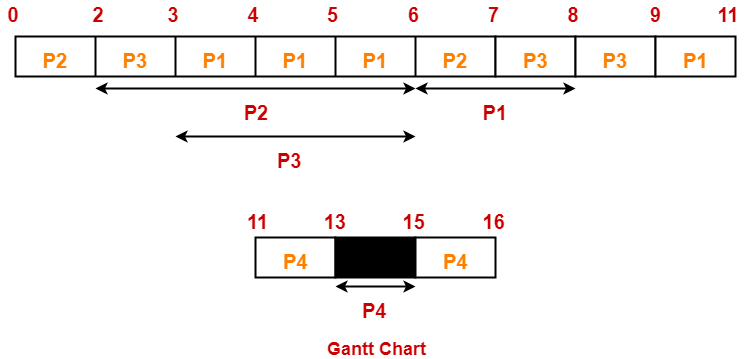


Now, we know-

  • Turn Around time = Exit time – Arrival time
  • Waiting time = Turn Around time – Burst time


Also read- Various Times Of Process


Process Id Exit time Turn Around time Waiting time
P1 11 11 – 0 = 11 11 – (3+2) = 6
P2 7 7 – 0 = 7 7 – (2+1) = 4
P3 9 9 – 2 = 7 7 – (1+2) = 4
P4 16 16 – 5 = 11 11 – (2+1) = 8


Now,

  • Average Turn Around time = (11 + 7 + 7 + 11) / 4 = 36 / 4 = 9 units
  • Average waiting time = (6 + 4 + 4 + 8) / 4 = 22 / 5 = 4.4 units


Problem-03:


Consider the set of 4 processes whose arrival time and burst time are given below-


Process No. Arrival Time Priority  Burst Time
CPU Burst I/O Burst CPU Burst
P1 0 2 1 5 3
P2 2 3 3 3 1
P3 3 1 2 3 1


If the CPU scheduling policy is Priority Scheduling, calculate the average waiting time and average turn around time. (Lower number means higher priority)


Solution-


The scheduling algorithm used is Priority Scheduling.


Gantt Chart-
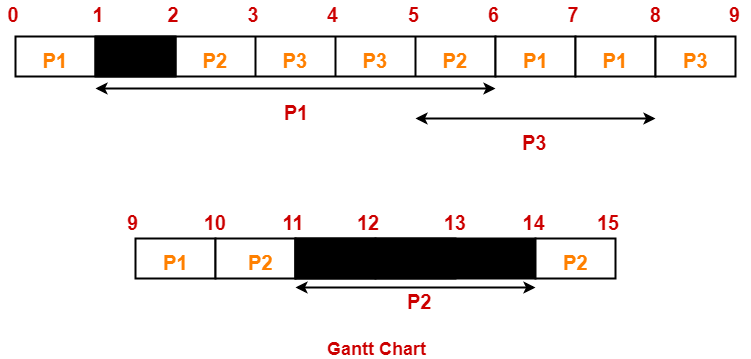


Now, we know-

  • Turn Around time = Exit time – Arrival time
  • Waiting time = Turn Around time – Burst time


Process Id Exit time Turn Around time Waiting time
P1 10 10 – 0 = 10 10 – (1+3) = 6
P2 15 15 – 2 = 13 13 – (3+1) = 9
P3 9 9 – 3 = 6 6 – (2+1) = 3


Now,

  • Average Turn Around time = (10 + 13 + 6) / 3 = 29 / 3 = 9.67 units
  • Average waiting time = (6 + 9 + 3) / 3 = 18 / 3 = 6 units


Next Article- Introduction to Process Synchronization


Get more notes and other study material of Operating System.

Watch video lectures by visiting our YouTube channel LearnVidFun.

HRRN Scheduling | CPU Scheduling

HRRN Scheduling-


In HRRN Scheduling,

  • Out of all the available processes, CPU is assigned to the process having highest response ratio.
  • In case of a tie, it is broken by FCFS Scheduling.
  • It operates only in non-preemptive mode.


Calculating Response Ratio-


Response Ratio (RR) for any process is calculated by using the formula-


where-

  • W = Waiting time of the process so far
  • B = Burst time or Service time of the process


Advantages-


  • It performs better than SJF Scheduling.
  • It not only favors the shorter jobs but also limits the waiting time of longer jobs.


Disadvantages-


  • It can not be implemented practically.
  • This is because burst time of the processes can not be known in advance.


PRACTICE PROBLEM BASED ON HRRN SCHEDULING-


Problem-


Consider the set of 5 processes whose arrival time and burst time are given below-


Process Id Arrival time Burst time
P0 0 3
P1 2 6
P2 4 4
P3 6 5
P4 8 2


If the CPU scheduling policy is Highest Response Ratio Next, calculate the average waiting time and average turn around time.


Solution-


Step-01:


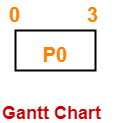
  • At t = 0, only the process P0 is available in the ready queue.
  • So, process P0 executes till its completion.


Step-02:


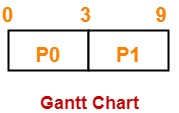
  • At t = 3, only the process P1 is available in the ready queue.
  • So, process P1 executes till its completion.


Step-03:


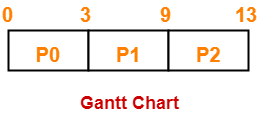
  • At t = 9, the processes P2, P3 and P4 are available in the ready queue.
  • The process having the highest response ratio will be executed next.


The response ratio are-

  • Response Ratio for process P2 = [(9-4) + 4] / 4 = 9 / 4 = 2.25
  • Response Ratio for process P3 = [(9-6) + 5] / 5 = 8 / 5 = 1.6
  • Response Ratio for process P4 = [(9-8) + 2] / 2 = 3 / 2 = 1.5


Since process P2 has the highest response ratio, so process P2 executes till completion.


Step-04:


  • At t = 13, the processes P3 and P4 are available in the ready queue.
  • The process having the highest response ratio will be executed next.


The response ratio are calculated as-

  • Response Ratio for process P3 = [(13-6) + 5] / 5 = 12 / 5 = 2.4
  • Response Ratio for process P4 = [(13-8) + 2] / 2 = 7 / 2 = 3.5


Since process P4 has the highest response ratio, so process P4 executes till completion.


Step-05:


  • At t = 15, only the process P3 is available in the ready queue.
  • So, process P3 executes till its completion.


Now, we know-

  • Turn Around time = Exit time – Arrival time
  • Waiting time = Turn Around time – Burst time


Also read- Various Times of Process


Process Id Exit time Turn Around time Waiting time
P0 3 3 – 0 = 3 3 – 3 = 0
P1 9 9 – 2 = 7 7 – 6 = 1
P2 13 13 – 4 = 9 9 – 4 = 5
P3 20 20 – 6 = 14 14 – 5 = 9
P4 15 15 – 8 = 7 7 – 2 = 5


Now,

  • Average Turn Around time = (3 + 7 + 9 + 14 + 7) / 5 = 40 / 5 = 8 units
  • Average waiting time = (0 + 1 + 5 + 9 + 5) / 5 = 20 / 5 = 4 units


To gain better understanding about HRRN Scheduling,

Watch this Video Lecture


Next Article- Round Robin Scheduling


Get more notes and other study material of Operating System.

Watch video lectures by visiting our YouTube channel LearnVidFun.
Predicting Burst Time | SJF Scheduling

SJF Scheduling-


Before you go through this article, make sure that you have gone through the previous article on SJF Scheduling.


In SJF Scheduling,

  • Out of all the available processes, CPU is assigned to the process having smallest burst time.
  • The main drawback of SJF Scheduling is that it can not be implemented practically.
  • This is because burst time of the processes can not be known in advance.


In this article, we will discuss techniques to predict burst time.


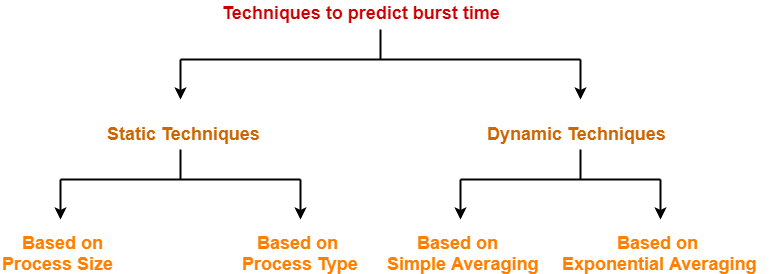
Techniques to Predict Burst Time-


There are several techniques which try to predict the burst time for the processes so that the algorithm can be implemented.

These techniques are-


Static Techniques-


There are two static techniques-

  1. Based on process size
  2. Based on process type


1. Based on Process Size-


  • This technique predicts the burst time for a process based on its size.
  • Burst time of the already executed process of similar size is taken as the burst time for the process to be executed.


Example-


  • Consider a process of size 200 KB took 20 units of time to complete its execution.
  • Then, burst time for any future process having size around 200 KB can be taken as 20 units.


NOTE

  • The predicted burst time may not always be right.
  • This is because the burst time of a process also depends on what kind of a process it is.


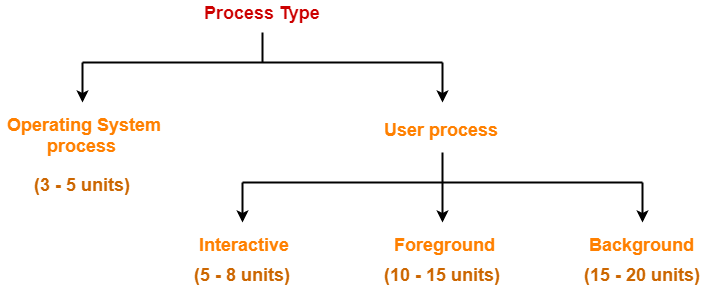
2. Based on Process Type-


  • This technique predicts the burst time for a process based on its type.
  • The following figure shows the burst time assumed for several kinds of processes.


Dynamic Techniques-


There are two dynamic techniques-

  1. Based on simple averaging
  2. Based on exponential averaging


1. Based on Simple Averaging-


  • Burst time for the process to be executed is taken as the average of all the processes that are executed till now.
  • Given n processes P1, P2, … , Pn and burst time of each process Pi as ti, then predicted burst time for process Pn+1 is given as-


2. Based on Exponential Averaging-


  • Given n processes P1, P2, … , Pn and burst time of each process Pi as ti. Then, predicted burst time for process Pn+1 is given as-


where-

  • α is called smoothening factor (0<= α <=1)
  • tn = actual burst time of process Pn
  • Tn = Predicted burst time for process Pn


PRACTICE PROBLEM BASED ON PREDICTING BURST TIME-


Problem-


Calculate the predicted burst time using exponential averaging for the fifth process if the predicted burst time for the first process is 10 units and actual burst time of the first four processes is 4, 8, 6 and 7 units respectively. Given α = 0.5.


Solution-


Given-

  • Predicted burst time for 1st process = 10 units
  • Actual burst time of the first four processes = 4, 8, 6, 7
  • α = 0.5


Predicted Burst Time for 2nd Process-


Predicted burst time for 2nd process

= α x Actual burst time of 1st process + (1-α) x Predicted burst time for 1st process

= 0.5 x 4 + 0.5 x 10

= 2 + 5

= 7 units


Predicted Burst Time for 3rd Process-


Predicted burst time for 3rd process

= α x Actual burst time of 2nd process + (1-α) x Predicted burst time for 2nd process

= 0.5 x 8 + 0.5 x 7

= 4 + 3.5

= 7.5 units


Predicted Burst Time for 4th Process-


Predicted burst time for 4th process

= α x Actual burst time of 3rd process + (1-α) x Predicted burst time for 3rd process

= 0.5 x 6 + 0.5 x 7.5

= 3 + 3.75

= 6.75 units


Predicted Burst Time for 5th Process-


Predicted burst time for 5th process

= α x Actual burst time of 4th process + (1-α) x Predicted burst time for 4th process

= 0.5 x 7 + 0.5 x 6.75

= 3.5 + 3.375

= 6.875 units


To gain better understanding about predicting burst time,

Watch this Video Lecture


Next Article- LJF Scheduling | LRTF Scheduling


Get more notes and other study material of Operating System.

Watch video lectures by visiting our YouTube channel LearnVidFun.
Longest Job First Algorithm | LRTF Scheduling

Longest Job First Algorithm-


In LJF Scheduling,

  • Out of all the available processes, CPU is assigned to the process having largest burst time.
  • In case of a tie, it is broken by FCFS Scheduling.


  • LJF Scheduling can be used in both preemptive and non-preemptive mode.
  • Preemptive mode of Longest Job First is called as Longest Remaining Time First (LRTF).


Advantages-


  • No process can complete until the longest job also reaches its completion.
  • All the processes approximately finishes at the same time.


Disadvantages-


  • The waiting time is high.
  • Processes with smaller burst time may starve for CPU.


PRACTICE PROBLEMS BASED ON LJF SCHEDULING-


Problem-01:


Consider the set of 5 processes whose arrival time and burst time are given below-


Process Id Arrival time Burst time
P1 0 3
P2 1 2
P3 2 4
P4 3 5
P5 4 6


If the CPU scheduling policy is LJF non-preemptive, calculate the average waiting time and average turn around time.


Solution-


Gantt Chart-


Now, we know-

  • Turn Around time = Exit time – Arrival time
  • Waiting time = Turn Around time – Burst time


Also read- Various Times of Process


Process Id Exit time Turn Around time Waiting time
P1 3 3 – 0 = 3 3 – 3 = 0
P2 20 20 – 1 = 19 19 – 2 = 17
P3 18 18 – 2 = 16 16 – 4 = 12
P4 8 8 – 3 = 5 5 – 5 = 0
P5 14 14 – 4 = 10 10 – 6 = 4


Now,

  • Average Turn Around time = (3 + 19 + 16 + 5 + 10) / 5 = 53 / 5 = 10.6 unit
  • Average waiting time = (0 + 17 + 12 + 0 + 4) / 5 = 33 / 5 = 6.6 unit


Problem-02:


Consider the set of 4 processes whose arrival time and burst time are given below-


Process Id Arrival time Burst time
P1 1 2
P2 2 4
P3 3 6
P4 4 8


If the CPU scheduling policy is LJF preemptive, calculate the average waiting time and average turn around time.


Solution-


Gantt Chart-


Now, we know-

  • Turn Around time = Exit time – Arrival time
  • Waiting time = Turn Around time – Burst time


Process Id Exit time Turn Around time Waiting time
P1 18 18 – 1 = 17 17 – 2 = 15
P2 19 19 – 2 = 17 17 – 4 = 13
P3 20 20 – 3 = 17 17 – 6 = 11
P4 21 21 – 4 = 17 17 – 8 = 9


Now,

  • Average Turn Around time = (17 + 17 + 17 + 17) / 4 = 68 / 4 = 17 unit
  • Average waiting time = (15 + 13 + 11 + 9) / 4 = 48 / 4 = 12 unit


Problem-03:


Consider three processes (process id 0, 1, 2 respectively) with compute time bursts 2, 4 and 8 time units. All processes arrive at time zero. Consider the longest remaining time first (LRTF) scheduling algorithm. In LRTF, ties are broken by giving priority to the process with the lowest process id. The average turn around time is-

  1. 13 unit
  2. 14 unit
  3. 15 unit
  4. 16 unit


Solution-


We have the set of 3 processes whose arrival time and burst time are given below-


Process Id Arrival time Burst time
P1 0 2
P2 0 4
P3 0 8


Gantt Chart-


Now, we know-

Turn Around time = Exit time – Arrival time


Process Id Exit time Turn Around time
P1 12 12 – 0 = 12
P2 13 13 – 0 = 13
P3 24 14 – 0 = 14


Now,

Average Turn Around time = (12 + 13 + 14) / 3 = 39 / 3 = 13 unit

Thus, Option (A) is correct.


To gain better understanding about LJF Scheduling,

Watch this Video Lecture


To gain better understanding about LRTF Scheduling,

Watch this Video Lecture


Next Article- Highest Response Ratio Next Scheduling


Get more notes and other study material of Operating System.

Watch video lectures by visiting our YouTube channel LearnVidFun.
Priority Scheduling | CPU Scheduling | Examples

Priority Scheduling-


In Priority Scheduling,

  • Out of all the available processes, CPU is assigned to the process having the highest priority.
  • In case of a tie, it is broken by FCFS Scheduling.


  • Priority Scheduling can be used in both preemptive and non-preemptive mode.


Advantages-


  • It considers the priority of the processes and allows the important processes to run first.
  • Priority scheduling in preemptive mode is best suited for real time operating system.


Disadvantages-


  • Processes with lesser priority may starve for CPU.
  • There is no idea of response time and waiting time.


Important Notes-


Note-01:


  • The waiting time for the process having the highest priority will always be zero in preemptive mode.
  • The waiting time for the process having the highest priority may not be zero in non-preemptive mode.


Note-02:


Priority scheduling in preemptive and non-preemptive mode behaves exactly same under following conditions-

  • The arrival time of all the processes is same
  • All the processes become available


PRACTICE PROBLEMS BASED ON PRIORITY SCHEDULING-


Problem-01:


Consider the set of 5 processes whose arrival time and burst time are given below-


Process Id Arrival time Burst time  Priority
P1 0 4 2
P2 1 3 3
P3 2 1 4
P4 3 5 5
P5 4 2 5


If the CPU scheduling policy is priority non-preemptive, calculate the average waiting time and average turn around time. (Higher number represents higher priority)


Solution-


Gantt Chart-


Now, we know-

  • Turn Around time = Exit time – Arrival time
  • Waiting time = Turn Around time – Burst time


Also read- Various Times of Process


Process Id Exit time Turn Around time Waiting time
P1 4 4 – 0 = 4 4 – 4 = 0
P2 15 15 – 1 = 14 14 – 3 = 11
P3 12 12 – 2 = 10 10 – 1 = 9
P4 9 9 – 3 = 6 6 – 5 = 1
P5 11 11 – 4 = 7 7 – 2 = 5


Now,

  • Average Turn Around time = (4 + 14 + 10 + 6 + 7) / 5 = 41 / 5 = 8.2 unit
  • Average waiting time = (0 + 11 + 9 + 1 + 5) / 5 = 26 / 5 = 5.2 unit


Problem-02:


Consider the set of 5 processes whose arrival time and burst time are given below-


Process Id Arrival time Burst time  Priority
P1 0 4 2
P2 1 3 3
P3 2 1 4
P4 3 5 5
P5 4 2 5


If the CPU scheduling policy is priority preemptive, calculate the average waiting time and average turn around time. (Higher number represents higher priority)


Solution-


Gantt Chart-


Now, we know-

  • Turn Around time = Exit time – Arrival time
  • Waiting time = Turn Around time – Burst time


Process Id Exit time Turn Around time Waiting time
P1 15 15 – 0 = 15 15 – 4 = 11
P2 12 12 – 1 = 11 11 – 3 = 8
P3 3 3 – 2 = 1 1 – 1 = 0
P4 8 8 – 3 = 5 5 – 5 = 0
P5 10 10 – 4 = 6 6 – 2 = 4


Now,

  • Average Turn Around time = (15 + 11 + 1 + 5 + 6) / 5 = 38 / 5 = 7.6 unit
  • Average waiting time = (11 + 8 + 0 + 0 + 4) / 5 = 23 / 5 = 4.6 unit


To gain better understanding about Priority Scheduling,

Watch this Video Lecture


Next Article- Practice Problems On CPU Scheduling Algorithms


Get more notes and other study material of Operating System.

Watch video lectures by visiting our YouTube channel LearnVidFun.