Converting ER Diagrams to Tables-
After designing an ER Diagram,
- ER diagram is converted into the tables in relational model.
- This is because relational models can be easily implemented by RDBMS like MySQL , Oracle etc.
Following rules are used for converting an ER diagram into the tables-
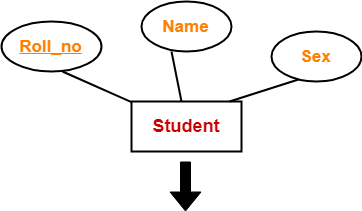
Rule-01: For Strong Entity Set With Only Simple Attributes-
A strong entity set with only simple attributes will require only one table in relational model.
- Attributes of the table will be the attributes of the entity set.
- The primary key of the table will be the key attribute of the entity set.
Example-

| Roll_no | Name | Sex |
|
|
Schema : Student ( Roll_no , Name , Sex )
Also Read- Entity Sets in DBMS
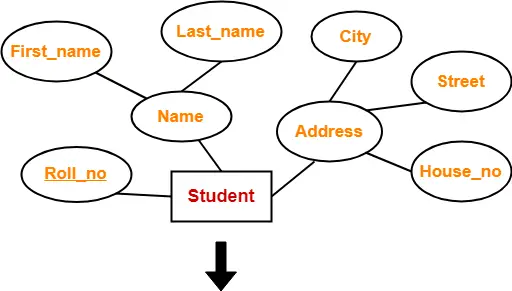
Rule-02: For Strong Entity Set With Composite Attributes-
- A strong entity set with any number of composite attributes will require only one table in relational model.
- While conversion, simple attributes of the composite attributes are taken into account and not the composite attribute itself.
Example-

| Roll_no | First_name | Last_name | House_no | Street | City |
|
|
Schema : Student ( Roll_no , First_name , Last_name , House_no , Street , City )
Also Read- Types of Attributes in DBMS
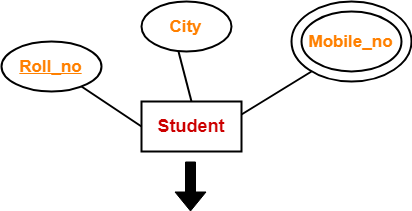
Rule-03: For Strong Entity Set With Multi Valued Attributes-
A strong entity set with any number of multi valued attributes will require two tables in relational model.
- One table will contain all the simple attributes with the primary key.
- Other table will contain the primary key and all the multi valued attributes.
Example-

| Roll_no | City |
|
|
| Roll_no | Mobile_no |
|
|
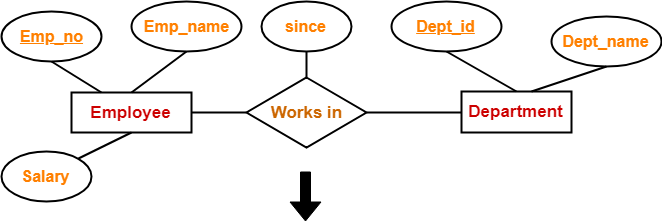
Rule-04: Translating Relationship Set into a Table-
A relationship set will require one table in the relational model.
Attributes of the table are-
- Primary key attributes of the participating entity sets
- Its own descriptive attributes if any.
Set of non-descriptive attributes will be the primary key.
Example-

| Emp_no | Dept_id | since |
|
|
Schema : Works in ( Emp_no , Dept_id , since )
NOTE-
If we consider the overall ER diagram, three tables will be required in relational model-
- One table for the entity set “Employee”
- One table for the entity set “Department”
- One table for the relationship set “Works in”
Rule-05: For Binary Relationships With Cardinality Ratios-
The following four cases are possible-
Case-01: Binary relationship with cardinality ratio m:n
Case-02: Binary relationship with cardinality ratio 1:n
Case-03: Binary relationship with cardinality ratio m:1
Case-04: Binary relationship with cardinality ratio 1:1
Also read- Cardinality Ratios in DBMS
Case-01: For Binary Relationship With Cardinality Ratio m:n

Here, three tables will be required-
- A ( a1 , a2 )
- R ( a1 , b1 )
- B ( b1 , b2 )
Case-02: For Binary Relationship With Cardinality Ratio 1:n

Here, two tables will be required-
- A ( a1 , a2 )
- BR ( a1 , b1 , b2 )
NOTE- Here, combined table will be drawn for the entity set B and relationship set R.
Case-03: For Binary Relationship With Cardinality Ratio m:1

Here, two tables will be required-
- AR ( a1 , a2 , b1 )
- B ( b1 , b2 )
NOTE- Here, combined table will be drawn for the entity set A and relationship set R.
Case-04: For Binary Relationship With Cardinality Ratio 1:1

Here, two tables will be required. Either combine ‘R’ with ‘A’ or ‘B’
Way-01:
- AR ( a1 , a2 , b1 )
- B ( b1 , b2 )
Way-02:
- A ( a1 , a2 )
- BR ( a1 , b1 , b2 )
Thumb Rules to Remember
While determining the minimum number of tables required for binary relationships with given cardinality ratios, following thumb rules must be kept in mind-
|
Rule-06: For Binary Relationship With Both Cardinality Constraints and Participation Constraints-
- Cardinality constraints will be implemented as discussed in Rule-05.
- Because of the total participation constraint, foreign key acquires NOT NULL constraint i.e. now foreign key can not be null.
Case-01: For Binary Relationship With Cardinality Constraint and Total Participation Constraint From One Side-

Because cardinality ratio = 1 : n , so we will combine the entity set B and relationship set R.
Then, two tables will be required-
- A ( a1 , a2 )
- BR ( a1 , b1 , b2 )
Because of total participation, foreign key a1 has acquired NOT NULL constraint, so it can’t be null now.
Case-02: For Binary Relationship With Cardinality Constraint and Total Participation Constraint From Both Sides-
If there is a key constraint from both the sides of an entity set with total participation, then that binary relationship is represented using only single table.

Here, Only one table is required.
- ARB ( a1 , a2 , b1 , b2 )
Rule-07: For Binary Relationship With Weak Entity Set-
Weak entity set always appears in association with identifying relationship with total participation constraint.

Here, two tables will be required-
- A ( a1 , a2 )
- BR ( a1 , b1 , b2 )
Next Article- Practice Problems On Converting ER Diagrams to Tables
Get more notes and other study material of Database Management System (DBMS).
Watch video lectures by visiting our YouTube channel LearnVidFun.

